Finding Co-Located Data
The map displays only two dimensions (latitude and longitude) of data, whereas data may actually have more dimensions. Possible additional dimensions are date and elevation or depth. There may also be quasi-dimensions such as categorical data attributes. Consequently there may be more than one row in the data set for every location on the map. Replication of observations may further increase the number of data rows at a single location, all with the same latitude/longitude coordinates.
When there are multiple data rows for a location, the symbols used on the map will all be drawn in the same place, and will likely not be distinguishable. Labels will also all be written in the same place. If the labels for all the data rows are not the same, the individual labels, and even the number of labels, are likely to be indistinguishable.
Mapdata has five features to identify and distinguish spatially co-located data:
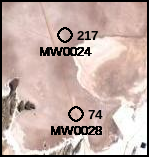
When the map is displayed, the hotkey Alt-C (“count”) will toggle on and off map annotations that show the number of data rows at each location that has more than one associated data row. This annotation appears to the right of each location. If there is only one data row for a location, the count will not appear; this is intended to reduce map clutter.
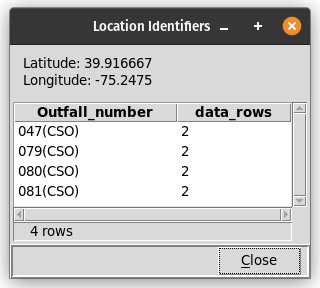
Right-clicking the mouse on a location marker will display a dialog box containing a table that lists every label at that location, and the number of data rows for each label. The latitude and longitude of the point that was clicked will be shown above the table.
The Selections/Co-located data menu item allows selection of data rows at locations with more than one row–or with any number of rows. These selections may be combined with other selections.

The Table/Counts by location menu item produces a table that lists all unique latitude and longitude values, and the number of data rows for each. If there are any text columns in the data table containing values that have a one-to-one relationship to unique coordinate pairs, those columns will be included in the table.
There are several sets of symbols that can be overplotted without overlapping. These include: concentric circles; concentric squares; the diag_ series; the q1-q4 series; and the q1_notch-q4_notch series with center8. There is also a hidden symbol that can be used to suppress the visual representation of some data rows at a location.