Graphical Plot Index
Data plots can be produced by options on the Plot menu and on
the Statistics menu. These options include several different
ways of producing some types of plots. For example, there are seven different
types of bar charts and four different types of scatter plots. This page
provides a visual index to the different types of plots. Each of the plot
descriptions links to the associated documentation page.

|
Box plot – one variable, multiple groups |

|
Box plot – multiple variables |

|
Bar chart of coefficient of variation by category |

|
Bar chart of counts by category |

|
Bar chart of means by category |

|
Bar chart of category percentages, by variable |

|
Bar chart of variable percentages, by category |

|
Bar chart of sums by category |

|
Bar charts of unmixing end members |

|
Bubble plot – three numeric variables, one categorical variable |

|
Categorical similarity matrix |

|
Correlation matrix |

|
Cosine similarity matrix |

|
Date range by category |

|
Empirical CDF |

|
Histogram |

|
Histogram with fitted distribution |

|
Jenks Natural Breaks |

|
Kernel density plot – one variable, multiple groups |

|
Kernel density plot – multiple variables |

|
Line plot – two variables, multiple groups, regression line |

|
Line plot – one X and multiple Y variables |
|
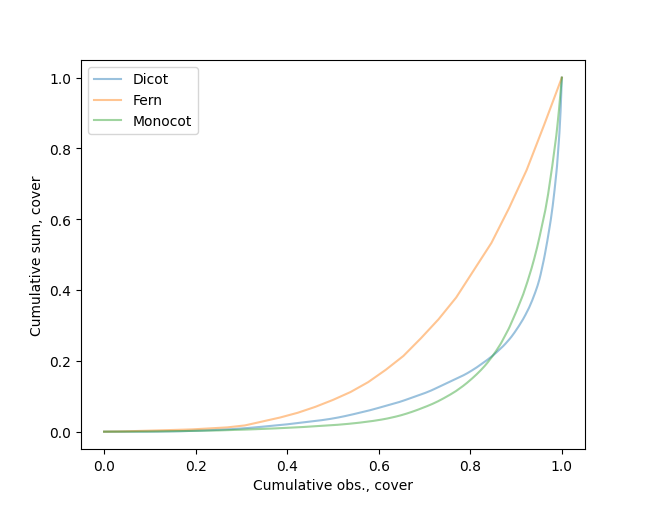
Lorenz curve |

|
Min-max by bin |

|
Min-max by category |

|
Normal Q-Q plot |

|
Pareto chart |

|
Pair plots |

|
PCA score plot |

|
Percent stacked area plot |

|
Rank abundance plot |

|
ROC curve |

|
Scatter plot – two variables, multiple groups, regression, LOESS, and Theil-Sen lines |

|
Scatter plot – one X and multiple Y variables |

|
Scatter plot with regression bands and Theil-Sen line |

|
Scatter plot of t-SNE results with k-means clusters |

|
Scatter plot of UMAP results with k-means clusters |

|
Stacked bar charts grouped by category |

|
Stacked bar charts grouped by variable |

|
Stripchart – one variable, multiple groups |

|
Stripchart – multiple variables |

|
Violin plot – one variable, multiple groups |

|
Violin plot – multiple variables |

|
Y range plot |
|
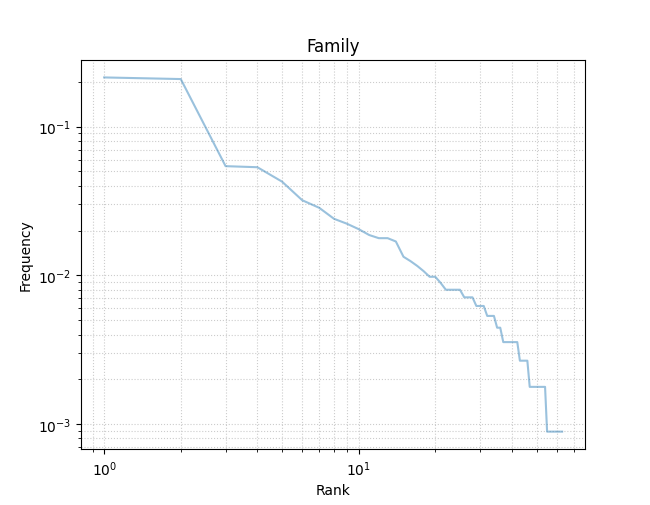
Zipf’s Law plot |