A Map-Based Data Explorer
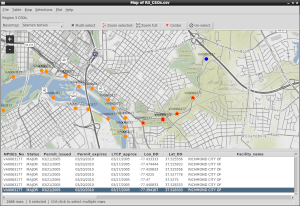
mapdata.py displays an interactive map with a table of underlying data to facilitate data exploration and analysis. The map can be used to select data for summarization, plotting, and statistical analyses.
Selecting a point on the map highlights the corresponding row in the table, and vice-versa. Data can also be selected and highlighted by entering query expressions.
Plots and statistical analyses may use all data rows in the data set or only the subset that has been selected from the map or data table. If different data are selected, all plots and data analyses will be automatically updated to reflect the change.
Data can be imported from a CSV file, spreadsheet file, or database.
Mapdata is intended to be easy and quick to use for exploration of a spatial data set. Mapdata is not intended to be a comprehensive analytics platform for either spatial or tabular data. Easy and flexible exploration of a data set with mapdata may, however, reveal characteristics of a data set that may be worthwhile to investigate in more detail with a geographic information system or statistical software.
Uses
You can use mapdata to:
Quickly visualize data in a spatial context. This may be useful for exploration of an unfamiliar data set.
Review attributes of locations on the map by clicking on those locations and examining the highlighted rows in the table.
Distinguish different types or categories of locations on the map, using different symbols or colors.
Use expressions to select data rows based on data values, and then highlight all of those data values in the table and on the map.
Evaluate or prepare data for loading into a database by identifying data types, recoding data, and finding or creating candidate keys for the data set as a whole or for unique geographic coordinates.
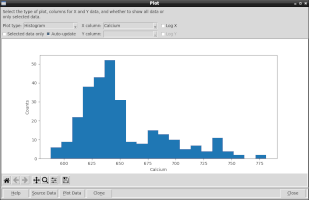
Plot data using scatter plots, line plots, box plots, kernel density plots, and other plot types.
Carry out univariate, bivariate, and multivariate statistical analyses on selected rows and columns of the data table.
Export data that have been summarized for plotting or statistical analysis for use with other statistical or plotting software.
Evaluate different coordinate reference systems (CRSs) for data sets where the CRS is uncertain.
Evaluate data completeness, uniqueness, and duplication to help determine how a data table should be factored into relational tables.
Export selected data to a CSV file or spreadsheet.
Export a map graphic showing location markers and selected locations.
Export plots and statistical results to document and communicate features of the data set.
Two columns of the data table must contain latitude and longitude values so that the data can be displayed on a map. However, plots and statistical analyses can be carried out even if the geographic coordinates are missing or inaccurate.