Working With the Map and Data Table
The following sections describe how to carry out different operations that may be performed with the map and locations displayed on the map.
Marking Selected Map Locations
A location on the map can by highlighted by clicking on the location marker that is shown on the map or by clicking on a row in the table that is displayed below the map. If the data table includes rows that have no coordinates, those rows can be selected by clicking in the table, but no corresponding highlight marker will appear on the map.
The data table will always automatically scroll to show the most recently selected location on the map.
Clicking on the location label on the map will also select the location. When locations and labels are closely clustered and overlapping on the map, zooming in may be required to make an accurate selection.
By default, only a single location can be selected at one time by clicking in the table or on the map. In this mode, clicking on a second location will cause the first to be un-selected. The Multi-select checkbox above the map can be used to enable selection of multiple locations at one time. If multi-select mode is turned on when one location has already been selected, that location will remain selected. If multi-select mode is turned off when any locations have been selected, all of those locations will be un-selected.
Multiple data values can also be selected by entering a query expression using the Selections / Data query menu option, which will bring up the Query Data dialog. This dialog can also be opened from the map display with the Alt-Q hotkey. The menu option Selections / Co-located data will open the Co-located Data dialog, which will allow selection of data based on the number of data rows at a location. Both the Query Data dialog and the Co-located Data dialog allow the selections to be combined with any existing selections in several different ways.
If many locations are to be included in the set of selected data values, and only a few are to be excluded, those that are to be excluded can be selected using the mouse or a query, and then the Selections / Invert menu option can be used to invert the selected set.
The default symbol that is used to mark selected locations is a red wedge (inverted triangle). This marker can be changed by loading a configuration file that specifies a different type of marker, or by using the Map / Change marker menu item. When the marker symobl is changed, all previously-selected items will still be marked as they were before the change. Therefore it is possible for the map to display several different types of symbols for selected locations.
Un-Marking Selected Map Locations
Highlighted locations can be un-marked on the map and table in the following ways:
To un-mark a single location on the map, which may correspond to multiple rows in the data table, Control-click on the location marker.
To un-mark an individual data value or location, when in multi-select mode, Control-click on a highlighted row in the table to remove the highlight.
To remove all highlight markers, use the “Un-select” button above the map or the Un-select all option on the Table and Map menus.
The Selections / Invert menu option will also un-select all selected locations, and select others.
The Selections / Data query menu option, and the Alt-Q keystroke, can be used to change the set of selected locations, which may result in un-marking some or all currently selected locations.
Moving and Changing the Map
To pan the map, click and drag with the mouse. To zoom in or out, use the “+” and “-” buttons at the top left of the map, or use the scroll wheel of the mouse.
The map display is also affected by the buttons that appear just above the map, as follows:
Zoom selectedWhen multiple locations are selected, this will change the displayed map extent to focus on just the selected locations. When only a single location is selected, this will center the map on that location, without changing the zoom level.
Zoom fullThis will set the map extent to display all of the locations, including selected and non-selected locations.
CenterThis will center the map on the most recently selected location, without changing the zoom level.
These operations can also be carried out from the Map menu.
The entire application window can be resized by dragging corners or edges with the mouse. In addition, the relative amounts of vertical space used by the map and data table can be changed by dragging the narrow bar that separates them.
Changing Location Symbols and Labels
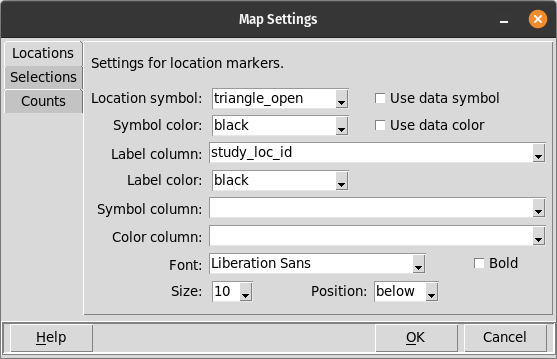
The type and color of location symbols, and the labeling for those symbols, can all be changed from the Map Settings dialog, which is available from the Map / Settings menu item. The data column used for labeling, as well as the font, font size, weight, and label position can all be changed using this dialog.
The font, size, color, and position (above or below) of location labels on the map can also be changed by loading a configuration file containing different specifications. These changes will take effect immediately. The column used for labeling cannont be specified in a configuration file; to change the column used, the Map Settings dialog must be used, or the data file must be re-loaded and the desired column name entered in the dialog box.
The size of labels can be changed by using either the Map / Settings dialog or by loading a configuration file with a label size specification. The size of location symbols can be changed by importing new symbols using the File / Import symbol menu option or by specifying additional symbols in a configuration file. Most of the built-in symbols are 16x16 X bitmaps, though not all use the entire 16x16 grid. Larger or smaller bitmaps can be created using several different software tools.
Changing the Symbol Used to Mark Selected Locations
The type of symbol, and symbol color, that are used to mark selected map locations can be changed on the Selections page of the Map Settings dialog that is available from the Map / Settings menu item. Changing the selection marker will affect all subsequently marked locations. Previously-marked locations will retain the symbol style that was previously used for them.
The marker symbol and color can also be changed by loading a configuration file containing different specifications.
Identifying Locations with Multiple Data Rows
The map displays only two dimensions (latitude and longitude) of data, whereas data may actually have more dimensions. Possible additional dimensions are date and elevation or depth. There may also be quasi-dimensions such as categorical data attributes. Consequently there may be more than one row in the data set for every location on the map. Replication may further increase the number of data rows at a single location, all with the same latitude/longitude coordinates.
When there are multiple data rows for a location, the symbols used on the map will all be drawn in the same place, and will likely not be distinguishable. Labels will also all be written in the same place. If the labels for all the data rows are not the same, the individual labels, and even the number of labels, are likely to be indistinguishable.
Mapdata has five features to identify and help work with spatially co-located data:
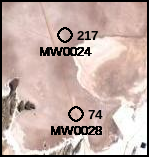
When the map is displayed, the hotkey Alt-C (“count”) will toggle on and off map annotations that show the number of data rows at each location that has more than one associated data row. This annotation appears to the right of each location. If there is only one data row for a location, the count will not appear; this is intended to reduce map clutter.
The menu option Selections / Co-located data allows selection of data rows at locations with more than one row–or with any number of rows. These selections may be combined with other selections.
The menu option Table / Counts by location produces a table that lists all unique latitude and longitude values, and the number of data rows for each. If there are any text columns in the data table containing values that have a one-to-one relationship to unique coordinate pairs, those columns will be included in the table.
There are several sets of symbols that can be overplotted without overlapping. These include: concentric circles; concentric squares; the diag_ series; the q1-q4 series; and the q1_notch-q4_notch series with center8. There is also a hidden symbol that can be used to suppress the visual representation of some data rows at a location.
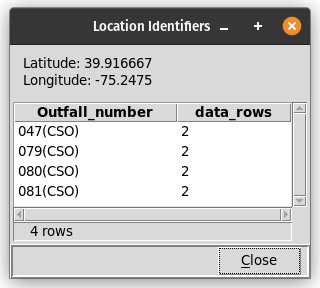
Right-clicking the mouse on a location marker will display a dialog box containing a table that lists every label at that location, and the number of data rows for each label.
Changing the Basemap
The basemap that is used can be changed by selecting a different item from the Basemap drop-down
list above the map. The list of available options can be extended by loading a
configuration file with appropriate specifications in the
basemap_tile_servers and map_attributions sections, and also in the
api_keys section if needed. Entries in the map_color_adj section of
a configuration file can be used to adjust the appearance of the basemap.
Such a configuration file can be loaded either on startup or by using the
File / Read config menu item.
If a tile server that requires an API key is specified in the basemap_tile_servers section of
a configuration file, but no corresponding API key is provided, that tile server will not appear
in the drop-down list.
Using a Data Set with No Map Coordinates
The plotting and statistical summaries of mapdata can be used with data sets that do not have any geographic coordinate data. To use such a data set, it is necessary to add dummy values of latitude and longitude to the data set. Values of 0 (zero) are simple and sufficient; these will cause the map display to show all data markers in the middle of the Gulf of Guinea. The map display can be minimized by using the mouse to click on the splitter bar between the map and data table, and dragging it up to the top of the display. The Table / Hide/show columns menu item can be used to remove the columns of dummy geographic coordinates from the displayed data table.
Sorting the Data Table
Clicking on a column header in the table will sort the table by the values in that column. Initially values will be sorted in ascending order, and successive clicks will reverse that order.
Changing the Data Set
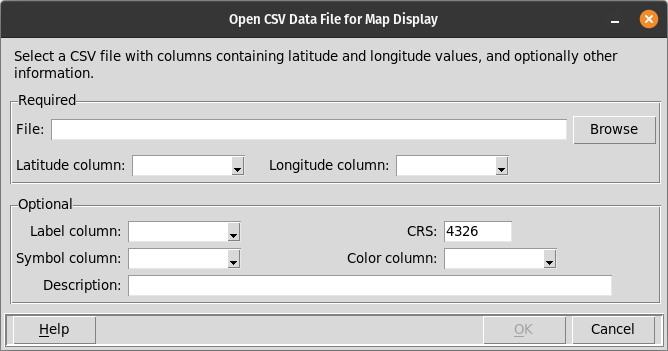
The data table that is displayed on the map and in the table below can be changed using the File / Open CSV, File / Open spreadsheet, and File / Open database menu items. The name of the data file or database table, and the names of the columns with latitude and longitude data must be entered in response to prompts on the dialog boxes that are presented. If the coordinate reference system (CRS) of the map is anything other than 4326, then the appropriate CRS must also be specified.
If the name of a label column is provided in response to the prompt, the values in that column will be used to label each location.
If columns containing symbol names and color names are provided, those values will be used instead of the default location marker for each location.
When the main mapdata window is resized, column widths in the data table may change also. Column widths can be manually adjusted by dragging a column header separator with the mouse.
The data table can be sorted, in ascending and descending order alternatively, by clicking on a column heading.
Adding or Changing Values in the Data Table
Values in columns of the data table can be changed, and new columns added, using the Table / Recode data menu option and the dialog that it displays. Values for only one column can be changed at a time. The changes can be applied to all data rows, only selected data rows, or only un-selected data rows. In addition, the changes may be applied only when the existing value is either missing or non-missing.
New values can be literal text or expressions that reference other columns in the table and that use SQL operators and functions.
Changing the Coordinate System
The CRS for the data can be changed using the Map / Change CRS menu item. An incorrect CRS will cause location markers to be displayed in the wrong places. In some cases these differences may be subtle, and identification of an incorrect CRS may require close examination of the map and reference to other descriptions or depictions of the locations.
In some cases the coordinate values in the data file may be so imcompatible with the selected (or default) CRS that the data cannot be displayed. If this is the case, mapdata may either issue an error message or, possibly, crash.
Finding or Creating Candidate Keys
A candidate key is any single column or set of columns that has a unique value (or combination of values, for a set of columns) for each data row. In a relational database, each table should have a primary key, which is also a candidate key.
Mapdata has several features to assist in the identification, or creation, of candidate keys:
The Table / Data types menu display can be used to identify individual columns that are candidate keys for the data set as a whole. Any column that has no (zero) missing values, and that has a number of unique values equal to the number of rows in the entire data set, is a candidate key.
The Table / Counts by location menu display will include any columns that are individually candidate keys for the set of unique latitude and longitude values. Note that these are not necessarily candidate keys for the data table as a whole.
The Table / Find candidate keys menu tool allows exploration of whether there are any multi-column candidate keys for the entire data set or a selected subset, or single-column candidate keys for a selected subset.
The Table / Add unique row ID menu item will create a unique row identifier for every row of the data table. This new identifier will be a candidate key.
The Table / Recode data menu tool can be used to replace missing values and resolve duplicate values, and thereby create candidate keys.
Saving an Image of the Map
The map, including all markers, can be exported to an image file using the Map / Export menu item. Supported image formats are Postscript (.ps), Portable Network Grapics (.png), and JPEG (.jpg). PNG and JPEG output will be an exact raster graphic of the map as it is shown by mapdata.py. Postscript output will contain a raster graphic of the basemap, but symbols will be represented by separate individual bitmaps, and labels will be represented by individual Postscript commands. Therefore, both symbols and labels in Postscript output can be edited or removed. The font used in Postscript output may differ from that which is displayed on the map.
Exporting Data for Selected Locations
If locations have been selected, the menu item Table / Export selected can be used to export just the selected rows of the table to a CSV file.
If the displayed data file has coordinates that are projected into some CRS other than 4326, the data file will have additional columns containing location coordinates in WGS84 (i.e., CRS 4326).