Dialogs
The following sections describe the prompts that mapdata.py presents via dialog boxes.
Select Mapping Data
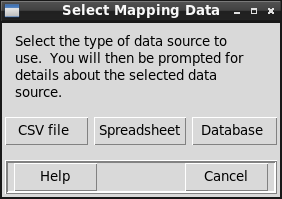
This dialog is the first thing that is displayed when mapdata.py is started in GUI mode. Each of the three buttons will result in the display of a different dialog that is specific to the data type, i.e., for a CSV data, spreadsheet, or database data source.
The “Cancel” button will exit mapdata.py without selecting or displaying any data.
Open CSV Data File
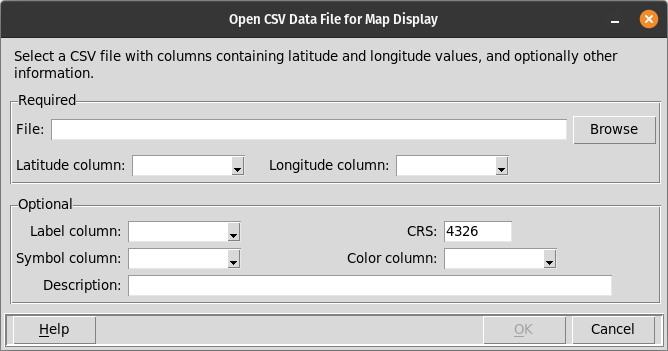
This dialog is displayed when mapdata.py is started in GUI mode and a CSV data source is selected, and also when the File / Open CSV menu option is selected.
This dialog is used to select the data file that will be shown in the application’s map and table displays. This dialog prompts for several pieces of information, some of which are required and some of which are optional. The “OK” button remains disabled until all of the required information is entered.
Required Information
- File
The name of the data file must be entered. This must be a comma-separated-value (CSV) file with an extension of “.csv”. The first line of the data file must contain column names. The filename may be typed into the prompt or the “Browse” button can be used to find and select the desired file.
- Latitude column
The name of the column in the data file that contains latitude values. Latitude values are expected to be in decimal degrees, in the WGS84 datum, by default. If the latitude (and longitude) values are in some other coordinate system, the appropriate Coordinate Reference System (CRS) value must be entered following the “CRS” prompt.
The drop-down list of column names will initially be empty, but will be populated after a valid CSV file has been identified.
- Longitude column
The name of the column in the data file that contains longitude values. Longitude values are expected to be in decimal degrees, in the WGS84 datum, by default. If the longitude (and latitude) values are in some other coordinate system, the appropriate Coordinate Reference System (CRS) value must be entered following the “CRS” prompt.
The drop-down list of column names will initially be empty, but will be populated after a valid CSV file has been identified.
Optional Information
- Label column
The name of a column in the data file that is to be used as a label for each location. The label will be displayed either above or below the marker for each location (below, by default, though this is configurable. If no column name is provided, locations on the map will not be labeled.
The drop-down list of column names will initially be empty, but will be populated after a valid CSV file has been identified.
- CRS
The Coordinate Reference System (CRS) code identifies the units, datum, and projection of the latitude and longitude values in the data file. The default value, 4326, corresponds to units of decimal degrees, in the WGS84 datum, and unprojected. If the coordinates are projected, the appropriate CRS must be entered.
mapdata.py does not provide a dropdown list will all valid CRS values. If the latitude and longitude values are projected, you must know the CRS value. If there is some uncertainty about the correct CRS value, the Map / Change CRS menu item can be used to change the CRS of a data file after it is imported.
- Symbol column
The name of a column in the data file that contains the names of symbols that are to be displayed at each location instead of the default symbol. mapdata.py includes 24 built-in symbols that can be used. Additional symbols can be loaded in a configuration file and using the File / Import symbol menu option.
The drop-down list of column names will initially be empty, but will be populated after a valid CSV file has been identified.
- Color column
The name of a column in the data file that contains the names of colors for the symbols at each location. The available color names are listed on the Colors page.
The drop-down list of column names will initially be empty, but will be populated after a valid CSV file has been identified.
- Description
Text to be displayed above the map on the main display window. This may describe the data set or contain other information helpful to the user.
Open Spreadsheet Data File
This dialog is displayed when mapdata.py is started in GUI mode and a spreadsheet data source is selected, and also when the File / Open spreadsheet menu option is selected.
This dialog has three pages.
Page 1:

Page 2:

Page 3:

On the first page the spreadsheet file must be identified. Either an OpenDocument (.ods) or an Excel (.xlsx and .xls) spreadsheet may be selected. The ‘Next’ button cannot be selected until a file name is entered.
The first page also allows an optional description of the data set to be entered. This description will appear above the map display.
The second page prompts for the name of the worksheet to read, and the number of initial rows to skip (if any). The name of the worksheet can be selected from a drop-down list of all of the worksheets in the workbook. The ‘Next’ button on this page cannot be selected until the sheet name is identified.
The third page of the dialog prompts for additional required and optional information that specifies what data to display, and how it is to be displayed. These elements of this page are described below. The ‘OK’ button cannot be selected until the latitude and longitude columns are identified. After the ‘OK’ button is selected, mapdata.py will create or update the map and table display to show the selected data.
Required Information
- Latitude column
The name of the column in the spreadsheet that contains latitude values. Latitude values are expected to be in decimal degrees, in the WGS84 datum, by default. If the latitude (and longitude) values are in some other coordinate system, the appropriate Coordinate Reference System (CRS) value must be entered following the “CRS” prompt.
- Longitude column
The name of the column in the spreadsheet that contains longitude values. Longitude values are expected to be in decimal degrees, in the WGS84 datum, by default. If the longitude (and latitude) values are in some other coordinate system, the appropriate Coordinate Reference System (CRS) value must be entered following the “CRS” prompt.
Optional Information
- Label column
The name of a column in the spreadsheet that is to be used as a label for each location. The label will be displayed either above or below the marker for each location (below, by default, though this is configurable. If no column name is provided, locations on the map will not be labeled.
- CRS
The Coordinate Reference System (CRS) code identifies the units, datum, and projection of the latitude and longitude values in the data file. The default value, 4326, corresponds to units of decimal degrees, in the WGS84 datum, and unprojected. If the coordinates are projected, the appropriate CRS must be entered.
mapdata.py does not provide a dropdown list will all valid CRS values. If the latitude and longitude values are projected, you must know the CRS value. If there is some uncertainty about the correct CRS value, the Map / Change CRS menu item can be used to change the CRS of a data file after it is imported.
- Symbol column
The name of a column in the spreadsheet that contains the names of symbols that are to be displayed at each location instead of the default symbol. mapdata.py includes 24 built-in symbols that can be used. Additional symbols can be loaded in a configuration file and using the File / Import symbol menu option.
- Color column
The name of a column in the spreadsheet that contains the names of colors for the symbols at each location. The available color names are listed on the Colors page.
Open Database Data Source
This dialog is displayed when mapdata.py is started in GUI mode and a database data source is selected, and also when the File / Open database menu option is selected.
This dialog has three pages.
Page 1:

Page 2:

Page 3:

The first page prompts for the type of database management system (DBMS) that is to be used, and the connection parameters necessary to connect to that database.
The supported DBMSs are:
PostgreSQL
SQLite
MariaDb/MySQL
SQL Server
Oracle
Firebird
DuckDB
The connection parameters that are needed differ for client-server databases and for file-based databases. SQLite and DuckDB are file-based databases, the others are client-server databases.
The first page of the dialog prompts for the following information for client-server databases:
- Server
The host name or IP address of the database server. This may be local or remote. If a host name is used, it must be present in the system’s hosts file. mapdata.py does not check this value.
- Database
The name of the database to be used. mapdata.py does not check this value.
- User
The name of the database user. This may or not be required, depending on the specific DMBS and how it is configured. mapdata.py does not check this value.
- Password
The database connection password for the specified user. This may or may not be required, depending on the specific DMBS and how it is configured. The password is obscured–shown as asterisks–when it is entered. mapdata.py does not check this value.
- Port
The port on the server that is used to connect to the database. The default port value for each of the client-server databases will be used if no alternate port is specified. mapdata.py does not check this value.
The ‘Next’ button on the first page of this dialog cannot be selected until values have been entered for the server and database for client-server databases.
For file-based databases, the first page of the dialog prompts for the following information:
- Database file name
The name of the file containing the database table with data to be mapped.
The ‘Next’ button on the first page of this dialog cannot be selected until values have been entered for the file name for file-based databases.
The second page of the dialog prompts for the name of the database table that contains the data to be mapped. The table name should be schema-qualified, if appropriate, for those DMMSs that support schemas. mapdata.py does not check this value.
The second page of the dialog also allows entry of SQL statements that will be executed prior to reading data from the selected table. The intended use of these SQL statements is to create (temporary) tables or views in the database to be read by mapdata.py if there is no base table that contains the desired information. The Open button reads in the contents of an existing SQL script file; the Save button saves the SQL commands in a new or existing script file, and the Edit button opens the SQL commands in an external editor. The Edit button is disabled if no editor has been identified, either by an environment variable named “EDITOR” or by specification in a configuration file.
The SQL statements entered on the second page of this dialog can use metacommands and substitution variables to implement conditional tests and loops. These features are described in the SQL Script Extensions section.
When the ‘Next’ button on the second page of the dialog is selected, mapdata.py will attempt to connect to the database and read data from the selected table. If any of the connection parameters are incorrect, mapdata.py will display an error message.
The third page of the database selection dialog prompts for additional required and optional information that specifies what data to display, and how it is to be displayed. These elements of this page are described below. The ‘OK’ button cannot be selected until the latitude and longitude columns are identified. After the ‘OK’ button is selected, mapdata.py will create or update the map and table display to show the selected data.
Required Information
- Latitude column
The name of the column in the database table that contains latitude values. Latitude values are expected to be in decimal degrees, in the WGS84 datum, by default. If the latitude (and longitude) values are in some other coordinate system, the appropriate Coordinate Reference System (CRS) value must be entered following the “CRS” prompt.
- Longitude column
The name of the column in the database table that contains longitude values. Longitude values are expected to be in decimal degrees, in the WGS84 datum, by default. If the longitude (and latitude) values are in some other coordinate system, the appropriate Coordinate Reference System (CRS) value must be entered following the “CRS” prompt.
Optional Information
- Label column
The name of a column in the database table that is to be used as a label for each location. The label will be displayed either above or below the marker for each location (below, by default, though this is configurable. If no column name is provided, locations on the map will not be labeled.
- CRS
The Coordinate Reference System (CRS) code identifies the units, datum, and projection of the latitude and longitude values in the data file. The default value, 4326, corresponds to units of decimal degrees, in the WGS84 datum, and unprojected. If the coordinates are projected, the appropriate CRS must be entered.
mapdata.py does not provide a dropdown list will all valid CRS values. If the latitude and longitude values are projected, you must know the CRS value. If there is some uncertainty about the correct CRS value, the Map / Change CRS menu item can be used to change the CRS of a data file after it is imported.
- Symbol column
The name of a column in the database table that contains the names of symbols that are to be displayed at each location instead of the default symbol. mapdata.py includes 24 built-in symbols that can be used. Additional symbols can be loaded in a configuration file and using the File / Import symbol menu option.
- Color column
The name of a column in the database table that contains the names of colors for the symbols at each location. The available color names are listed on the Colors page.
- Description
Text to be displayed above the map on the main display window. This may describe the data set or contain other information helpful to the user.
Import Symbol Dialog

This dialog is displayed when the File / Import symbol menu option is selected. It allows the user to import a new symbol to be used as a marker for selected locations on the map. Both the symbol name and the file name must be specified. The file name may be typed in directly, or the “Browse” button can be used to find and select the desired file.
Symbol names are case-sensitive. Any built-in symbol can be re-defined by loading a new symbol file and using the same name as a built-in symbol.
Symbol files must be in the X bitmap format (.xbm), which defines a monochrome bitmap. Additional symbols can be downloaded from the OSDN project page. The color to be used for selected marker symbols is specified separately, either via the Map / Change marker menu item or the default setting in a configuration file.
Hide/Show Columns Dialog

The columns shown in the table below the map can be modified using this dialog. The dialog contains a checkbox for every column in the data table. If the checkbox for a column is checked, the column will be shown, and if it is unchecked, the column will be hidden.
The ‘Hide’ button above the checkboxes will uncheck all columns except for the first. the ‘Show’ button will check all columns.
If there is only one column checked, and an attempt is made to un-check it, a warning message will be displayed and the first column will be automatically checked.
The ‘OK’ button will close the dialog and make changes to the table, and the ‘Cancel’ button will close the dialog without making any changes to the table.
Find Candidate Keys Dialog

A candidate key is any column or set of columns for which the values are unique on every row of a data table. In a relational database, the primary key is a candidate key (maybe the only one).
This dialog is displayed when the Table / Find candidate keys menu option is selected. It displays a list of columns in the data table, allows one or more to be selected, and checks whether they qualify as a candidate key. The check may be performed for all data in the data table or only for the data rows that are highlighted in the main data table and on the map.
The results of the check are displayed below the list of columns. A set of columns may fail to qualify as a candidate key either because one or more of them contains a missing (null) value or because the set includes duplicate values.
The list of columns that is displayed does not include any that are themselves, singly, a candidate key for the entire data set. Any column in the Table / Data types menu summary that has no (zero) missing values, and a number of unique values that is equal to the number of rows in the data set is itself a candidate key for the entire data set and for any selected subset.
Recode Data

This dialog is displayed when the Table / Recode data menu option is selected. It prompts for information needed to modify, or add, data to the data table. The following items must be specified:
- Data type
The type of expression result must be identified. It may be either a text string, a real (floating-point) number, or an integer. This choice is used to determine which existing columns may be selected, and is also used to check the validity of the expression that is used.
- New or existing column name
Either an existing column name can be selected from the drop-down box, or a new column name can be entered. If an existing column name is used, values in that column will be replaced, and if a new column name is entered, that column will be added to the right-hand end of the table.
- Values to replace
The two sets of three options determine which rows will have their value replaced. One set of options is used to specify whether, and how, previously selected (highlighted) rows in the table will determine which values are replaced. The other set of option is used to used to specify whether, and how, the replacements may be restricted to missing or non-missing values.
- Expression
The expression to use to populate the column should be typed into the text area. The expression must be valid SQL. The expression may include column names, literal values, operators, and functions. Column names should contain only alphanumeric characters and underscores; any other character should be replaced with an underscore. String literals must be enclosed in single quotation marks. Operators and functions must be consistent with the SQLite dialect of SQL. The buttons to the left of the text entry area can be used to erase an existing expression, to read an expression from a file, to save the expression to a file, and to edit the expression if an external editor has been specified (with the File / Set editor menu command or in a configuration file).
After the desired specifications have been entered and the OK button pressed, the expression will be evaluated. If the expression is invalid, a warning message will be displayed and no data will be changed. If the expression is valid, the data table will be updated. Some specifications may be valid but result in no changes to data–for example, if the changes are to be made to empty rows only, and there are no empty rows, then nothing will be changed.
If a valid expression is used, then it will be saved and used to initialize the text entry area when this dialog is next opened. This provides some consistency when a sequence of similar changes are to be made.
Add Unique Row IDs

This dialog is displayed when the Table / Add unique row IDs menu option is selected. The dialog allows the addition of a new column to the data table that contains a unique identifier for every row of the table. The dialog contains prompts for the name of a new column for the data table and, optionally, for a prefix for the identifiers. The new row identifiers will be numeric, left-padded with zeroes. If a prefix is specified, it will be separated from the numeric part of the identifier with an underscore.
Change CRS

This dialog is displayed when the Map / Change CRS menu option is selected. It prompts the user for a new coordinate reference system (CRS) identifier. After a new CRS value is selected, mapdata.py converts all the latitude and longitude coordinates in the data file to the newly selected CRS and re-displays them map.
mapdata.py does not provide a list of all of the possible CRS values that may be used. External metadata may need to be consulted to identify the correct CRS for each data set.
Map Settings
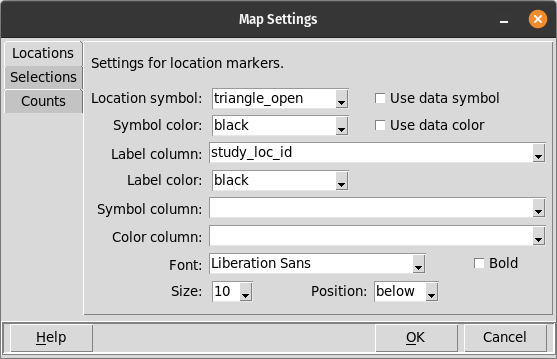
This dialog is displayed when the Map / Settings menu option is selected. It has three tabbed pages, each of which has settings used for different purposes:
The Locations page contains settings that affect the display of location markers and labels. A location marker is displayed for every row in the data file that has geographic coordinates.
The Selections page contains settings that affect the appearance of selection markers that appear on the map when you click on a location marker on the map or click on a row of the data table.
The Counts page contains settings that affect the appearance of the labels that appear to the right of location markers and that display the number of data (table) rows at that location.
The controls on each page are described in the following sections.
Locations page
These settings affect the display of location markers and labels.
- Location symbol
The symbol that is used for the location marker, unless symbols are specified in the data table. A symbol may be selected from a drop-down list. The items in this list include the built-in symbols plus any additional symbols that have been specified in a configuration file or imported with the File / Import symbol menu option.
- Use data symbol
When checked, then if symbol names are specified in the data file, they will be used instead of the default location symbol. If this is not checked, the default location symbol will always be used.
- Symbol color
The color to be used for the default symbol, unless symbol colors are specified in the data table. The symbol color can be chosen from a drop-down list of all of the built-in colors.
- Use data color
When checked, then if color names are specified in the data file, they will be used instead of the default location color. If this is not checked, the default location color will always be used.
- Label column
The column from the data source that is used to label each location. The column can be chosen from a drop-down list containing the names of all columns in the data table. If no labels are to be shown, the blank entry at the top of the drop-down list should be selected.
- Label color
The color to be used for the label for each location marker. The label color can be chosen from a drop-down list of all of the built-in colors.
- Symbol column
The name of the column in the data table that contains symbol names, to be used as a location marker instead of the default symbol. If this column does not contain any valid symbol names, the default symbol will be used instead. The Use data symbol setting must be checked for this symbol specification to be used.
- Color column
The name of the column in the data table that contains color names, to be used to color the location markers instead of the default color. If this column does not contain any valid color names, the default color will be used instead. The Use data color setting must be checked for this color specification to be used.
- Font
The font family to be used to display the label can be selected from a drop-down list. This list includes all fonts that are available on the computer.
- Bold
This checkbox controls whether or not the label is shown in a bold face.
- Size
The size for the location label can be chosen from a drop-down box. Alternate values can also be entered if desired.
- Position
Labels can be displayed either above or below the location marker, and the desired position can be chosen from this drop-down box.
Selections page
These settings affect the display of selection markers.
- Marker symbol
The symbol that is used to highlight locations that have been selected on the map. A new symbol can be selected from the dropdown list. The items in this list include the built-in symbols plus any additional symbols that have been specified in a configuration file or imported with the File / Import symbol menu option.
- Color
The color to be used for the selection symbol. The symbol color can be chosen from a drop-down list of all of the built-in colors.
When a new selection symbol is chosen, all locations on the map that are subsequently selected by clicking on the map or table will be marked with the newly selected symbol. Previously marked symbols will remain marked as they were.
Counts page
These settings affect the display of data row counts for each location. Data row counts are only shown when there is more than one data row for a location.
- Font
The font family to be used to display the count can be selected from a drop-down list. This list includes all fonts that are available on the computer.
- Size
The size for the count label can be chosen from a drop-down box. Alternate values can also be entered if desired.
- Color
The color to be used for the count label. The label color can be chosen from a drop-down list of all of the built-in colors.
- Offset
The distance, in pixels, from the location point that the count label will be displayed. Most of the built-in symbols have a half-width of 8 pixels. The default offset of 12 pixels places the count label 4 pixels to the right of the location marker. If a larger location marker is used, the offset may need to be increased.
- Show counts
This checkbox controls whether or not count labels are displayed. It has the same effect as using the Alt-C keystroke when the map interface has the focus.
Query Data

This dialog is displayed when the Selections / Data query menu option is selected or the Alt-Q hotkey is used from the map interface. It prompts for an expression that is used to select rows to be highlighted on the table and map. The expression should be in the form of a SQL ‘WHERE’ clause. The WHERE clause can use any operators and functions that are recognized by SQLite.
Column names used in the expression are not case-sensitive, but any column name that contains spaces must be entered with underscores in place of the spaces. Data values are case-sensitive. Text data values must be single-quoted.
The query expression should be entered in the text box in the center of the dialog. Above the text box are buttons that will insert individual SQL elements into the query expression. Clicking on any of these buttons will insert the corresponding element at the end of the SQL expression. To the left of the text box are buttons that affect the SQL entry as a whole.
On the right side of the dialog box is a drop-down list from which any of the table column names can be selected. Note that the column names in the drop-down list may differ slightly from those shown in the data table; for example, they will have spaces replaced with underscores. After a column is selected from the drop-down list, all unique values present in that column will be listed below the drop-down box. Double-clicking on any of these values will copy it to the end of the SQL expression. Numeric values will be unquoted, and text values will be quoted. The arrow button to the right of the drop-down box will copy the selected column name to the end of the query expression.
Below the text box for the query expression is a drop-down list that specifies the action to be taken with the results of the query expression. The available actions are:
Replace: All currently selected data are replaced with the results of the query.
Union: The results of the query will be added to any previously-selected set of values.
Intersection: Only the table rows that are in both the previously-selected set and the newly-selected set will be retained.
Difference O-N: The results of the query (New) will be subtracted from any previously-selected set of values (Old).
Difference N-O: The set of previously-selected values (Old) will be subtracted from the newly-selected set of values (Nnew).
The Replace action is the default.
When the ‘OK’ button is selected, the query expression will be evaluated. If it is invalid, an error message will be displayed. If it is valid, the selected data values will be updated in the table and on the map.
Co-Located Data Dialog

This dialog is displayed when the Selections / Co-located Data menu option is selected. A data set may contain multiple data values at the same location, differing by date, depth or elevation, or other attributes. The presence of multiple values at a location is not necessarily apparent on the map, except by the overlapping labels or if different symbols are used.
This dialog allows locations with multiple data values, or locations with only a single data value, to be easily selected and highlighted on the map and in the table. Locations can be selected that have more than, less than, or exactly a specified number of data values.
Below the prompts for data selection criteria is a drop-down list that specifies the action to be taken with the results of the data selection. The available actions are:
Replace: All currently selected data are replaced with the newly selected data.
Union: The results of the new data selection will be added to any previously-selected set of values.
Intersection: Only the table rows that are in both the previously-selected set and the newly-selected set will be retained.
Difference O-N: The results of the new data selection (New) will be subtracted from any previously-selected set of values (Old).
Difference N-O: The set of previously-selected values (Old) will be subtracted from the newly-selected set of values (Nnew).
The Replace action is the default.
When the ‘OK’ button is selected, the selection criteria will be evaluated. If it is invalid, an error message will be displayed. If it is valid, the selected data values will be updated in the table and on the map.
Plot Dialog

This dialog is used to select and display several different types of data plots. A plot type must be selected from the drop-down box and then, depending on the plot type, appropriate X, Y, and grouping variables may be selected. Checkboxes allow quantitative variables (with floating-point or integer values) to be log10-transformed. After selections are made using the dropdown boxes and checkboxes, a plot will be displayed in the center of the dialog.
The graphic buttons immediately below the plot can be used to zoom and pan the plot, and to save the plot to a file.
After the plot is generated, the Source Data and Plot Data buttons at the bottom of the dialog will open a tabular display of the data used for the plot. The Clone button opens another plot dialog with the same selections as the current one, so that it is easy to compare similar plots.
The different types of plots that can be produced, the ways in which data can be selected for plotting, and the options for customizing plots are described on the Plots page.
The plot dialog can be opened either with the Plot / New menu option or by using the Alt-G keystroke from the main application.
Pair Plot Dialog

This dialog is used to select and display a matrix of scatter plots for each pair of a selected set of variables. The diagonal of this matrix contains a kernel density (KD) plot for the variable that is on both axes of the matrix.
The variables to be plotted are chosen by clicking on them in the list on the left side of the dialog. Control-click and Shift-click combinations can be used to select multiple variables. At least two variables must be selected.
The checkboxes above the list of variables can be used to specify
Whether all of the data should be used, or only the data values highlighted on the map and in the table.
Whether the data should be log10-transformed before plotting.
The dropdown box below the list of variables allows a categorical variable to be selected, to distinguish sub-groups within the selected data set. Each sub-group will be distinctly colored on the scatter and KD plots.
The pair plots will be updated automatically whenever any change is made to the data to be plotted.
The opacity (alpha value) of symbols on the plots can be modified with the Alt-A keystroke.
Plot Configuration Dialog

This dialog prompts for customization of some settings that are used when displaying plots. The settings are:
Display a dialog showing the R2 value when a scatter plot is drawn. More regression diagnostics can be seen on the Bivariate Statistics dialog. This display provides quick feedback when changing data selections or data transformations.
Text wrapping width for plot tick labels. Some plots (e.g., stripcharts) will wrap long labels for values on the X axis. This setting changes the width at which labels are wrapped.
Wrap labels at underscores. This setting will cause underscores to be replaced with spaces in tick labels, and the labels may then be wrapped at the former positions of the underscores.
Univariate Statistics Dialog

This dialog prompts the user to select:
One or more numeric variables.
Whether to use all data in the data table or or just the subset that has been selected (e.g., by clicking on the table or map).
The dialog then displays a table of univariate statistics for all of the variables, both untransformed and log10-transformed. The table of statistics is immediately updated if any changes are made to the user’s selections on this dialog or, if only selected data are being used, changes are made to the selected data.
All of the statistics that are calculated are described in the Univariate Statistics section.
Distribution Fitting Dialog

This dialog prompts the user to select:
The numeric variable to be fit. Integer variables are treated as if they are continuous variables.
Whether to use log-transformed values for each of them.
Whether to use all data in the data table or just the subset that has been selected (e.g., by clicking on the table or map).
The type of distribution to be fit to the data.
As soon as a numeric variable has been selected, a histogram of the values of that variable will be displayed in the lower left. After a distribution has been selected, the density distribution for the fitted distribution will be overlain on the histogram, and the parameters and goodness-of-fit statistics for that distribution will be shown to the right of the plot.
Multiple distributions can be fitted and visualized on the same histogram. Any change to the data will cause the histogram to be re-created without any of the previously fitted distributions or statistics.
The types of distributions that can be selected depend on the range of the data. For example, if the data values are all within the (0, 1) interval, only the Beta and Uniform distributions can be fitted.
The number of bins displayed on the histogram can be altered with the <Alt-B> keystroke, and the table of statistics can be saved to a CSV file with the <Ctrl-S> keystroke.
Bivariate Statistics Dialog

This dialog prompts the user to select:
Two numeric variables.
Whether to use log-transformed values for each of them.
Whether to use all data in the data table or just the subset that has been selected (e.g., by clicking on the table or map).
After these selection have been made, the dialog then displays a table of bivariate statistics and a scatter plot of the two variables with a regression line. The table of statistics is immediately updated if any changes are made to the user’s selections on this dialog or, if only selected data are being used, changes are made to the selected data.
All of the statistics that are calculated are described in the Bivariate Statistics section.
Correlation Matrix Dialog

This dialog prompts the user to select:
Two or more numeric variables from a list that is displayed at the left side of the dialog.
Whether to use all data in the data table or just the subset that has been selected (e.g., by clicking on the table or map).
Whether to log10 transform the data.
The dialog then displays a correlation matrix on the right side of the dialog. The correlation matrix is immediately updated if any changes are made to the user’s selections on this dialog or, if only selected data are being used, changes are made to the selected data.
Additional information about the correlation matrix is in the Correlation Matrix section.
Contingency Table Dialog

This dialog prompts the user to select:
Two numeric or categorical variables from drop-down lists.
For each variable, how to subdivide the values into ‘positive’ and ‘negative’ subsets. For numeric variables, an upper or lower threshold must be specified. For categorical variables, the ‘positive’ group of values must be selected from a list box.
The dialog then displays a contingency table of the number of co-occurrences of positive and negative values for each variable, and a table of statistics. The contingency table is immediately updated if any changes are made to the user’s selections on this dialog or, if only selected data are being used, changes are made to the selected data.
A description of the statistics that are displayed is in the Contingency Table section.
Receiver Operating Characteristics Dialog

This dialog prompts the user to select:
A numeric or categorical condition variable.
How to subdivide the values of the condition variable into ‘positive’ and ‘negative’ subsets. For numeric variables, an upper or lower threshold must be specified. For categorical variables, the ‘positive’ group of values must be selected from a list box.
A numeric predictor variable.
A threshold value for the predictor variable.
The dialog then displays a Receiver Operating Characteristic (ROC) curve (Fawcett 2006), and ROC statistics for the threshold value of the predictor variable. The ROC plot and table are immediately updated if any changes are made to the user’s selections on this dialog or, if only selected data are being used, changes are made to the selected data.
A description of the ROC statistics that are displayed is in the Receiver Operating Characteristics section.
t-SNE Analysis Dialog

This dialog evaluates the similarity of data rows in the main data table, using values of three or more numeric variables. The method used is t-Distributed Stochastic Neighbor Embedding (t-SNE; van der Maaten and Hinton, 2008), which represents a multivariate data set in two dimensions, where closer points are more similar to each other than to more distant points.
This dialog prompts the user to select:
Whether to carry out this analysis for all data in the data table or only for the subset that is selected on the map and in the data table.
Three or more variables from the list displayed at the left of the dialog.
A value for perplexity, which affects the separation of points. Low values of perplexity show finer structure in the data, but may also represent random variation, and larger values produce output that shows only major groupings of points. If a perplexity value is entered that is greater than the number of selected data rows, it will be automatically set equal to half of the number of selected data rows.
Optionally, a grouping variable. This will not affect the t-SNE calculation, but will used to color points by group in the scatter plot that is produced.
After these values have been set, the ‘Calculate’ button will initiate the t-SNE calculation.
The results of the t-SNE calculation will be displayed in a scatter plot on the right side of the dialog. If points are labeled on the map, hovering over a point on the scatter plot with the mouse will pop up the label for that point. The transparency (alpha value) of the points can be modified with the Alt-A keystroke.
The “Data Table” button below the plot will display a table of the coordinates of every point in the two dimensions shown in the scatter plot. Labels and grouping values will be included in this table if they have been specified. The table can be saved using the Ctrl-S keystroke.
The “k-Means clusters / Create” button will perform a k-means cluster analysis of the t-SNE coordinate data. A prompt will be presented to select the number of clusters. Uniquely colored wedge symbols will be displayed on the scatter plot to identify the cluster for each data point, and the plot legend will display cluster identifiers.
The “k-Means clusters / Add Column” button will prompt for the name of a new or existing column, and then add or update that column with the cluster identifiers for each row.
UMAP Analysis Dialog

This dialog evaluates the similarity of data rows in the main data table, using values of three or more numeric variables. The method used is Uniform Manifold Approximation and Projection (UMAP; McInnes et al., 2020), which represents a multivariate data set in two dimensions, where closer points are more similar to each other than to more distant points.
This dialog prompts the user to select:
Whether to carry out this analysis for all data in the data table or only for the subset that is selected on the map and in the data table.
Three or more variables from the list displayed at the left of the dialog.
The number of neighbors around each point, in multivariate space, to be used when evaluating the structure of the data. Values may range from 2 to one-quarter of the total number of data rows. Smaller values highlight fine structural features, and larger numbers highlight more global structure.
The minimum distance of adjacent points in the projected (two-dimensional) space. Values range from 0 to 0.99. Smaller numbers cause similar points to be displayed more closely together.
The distance metric to be used to evaluate the multivariate similarity between data points. Available metrics are: Bray-Curtis, Canberra, Chebyshev, Cosine-theta, Correlation, Euclidean, Manhattan, and Minkowski.
Optionally, a grouping variable. This will not affect the UMAP calculation, but will used to color points by group in the scatter plot that is produced.
After these values have been set, the ‘Calculate’ button will initiate the UMAP calculation.
The results of the dimensionality reduction calculation will be displayed in a scatter plot on the right side of the dialog. If points are labeled on the map, hovering over a point on the scatter plot with the mouse will pop up the label for that point. The transparency (alpha value) of the points can be modified with the Alt-A keystroke.
The “Data Table” button below the plot will display a table of the coordinates of every point in the two dimensions shown in the scatter plot. Labels and grouping values will be included in this table if they have been specified. The table can be saved using the Ctrl-S keystroke.
The “k-Means clusters / Create” button will perform a k-means cluster analysis of the UMAP coordinate data. A prompt will be presented to select the number of clusters. Uniquely colored wedge symbols will be displayed on the scatter plot to identify the cluster for each data point, and the plot legend will display cluster identifiers.
The “k-Means clusters / Add Column” button will prompt for the name of a new or existing column, and then add or update that column with the cluster identifiers for each row.
Categorical Correspondence Dialog

This dialog prompts for:
Two different categorical variables,
Whether to use all data in the data table or just the subset that has been selected (e.g., by clicking on the table or map).
The dialog then displays a table showing all unique combinations of those variables and the number and percentage of data rows associated with each combination. The table is immediately updated if any changes are made to the user’s selections on this dialog or, if only selected data are being used, changes are made to the selected data.
Additional information is in the Categorical Correspondence section.